
Restaurant order management dashboard
Manage Orders, Staff, Refunds, and Restaurant Analytics From One Owner Dashboard.
Give owners, managers, and employees the tools appropriate to their role. Then turn paid online-order data into clear revenue, customer, menu, demand, basket, fulfillment, and refund intelligence.
- Incoming orders, dashboard refunds, and role-based access
- Period comparisons across revenue, customers, menu, and demand
- Ranked opportunities translated from paid-order behavior
Full analytics on Growth and Multi-location
What is included
One operational and intelligence layer for direct online orders.
The owner side connects the work after checkout with the questions behind better decisions: what changed, what sells, when demand peaks, how customers return, and where the next opportunity may be hiding.
Incoming-order workflow
Keep direct online orders organized in a restaurant-facing view designed for the staff members responsible for fulfillment.
Role-based access
Give owners, managers, and employees the appropriate level of access instead of exposing every control to every person.
Dashboard refunds
Allow authorized owners to issue customer refunds from the platform without leaving the restaurant management experience.
Owner-only intelligence
Compare selected periods and review revenue, customer, basket, menu, demand, fulfillment, and refund signals built from paid online orders.
A closer look at owner analytics
Know what changed, what sells, and what to do next.
The analytics dashboard goes beyond a basic sales total. It organizes paid online-order behavior into scorecards, trends, customer and menu intelligence, demand planning, operational health, and prioritized actions.
Business scorecard
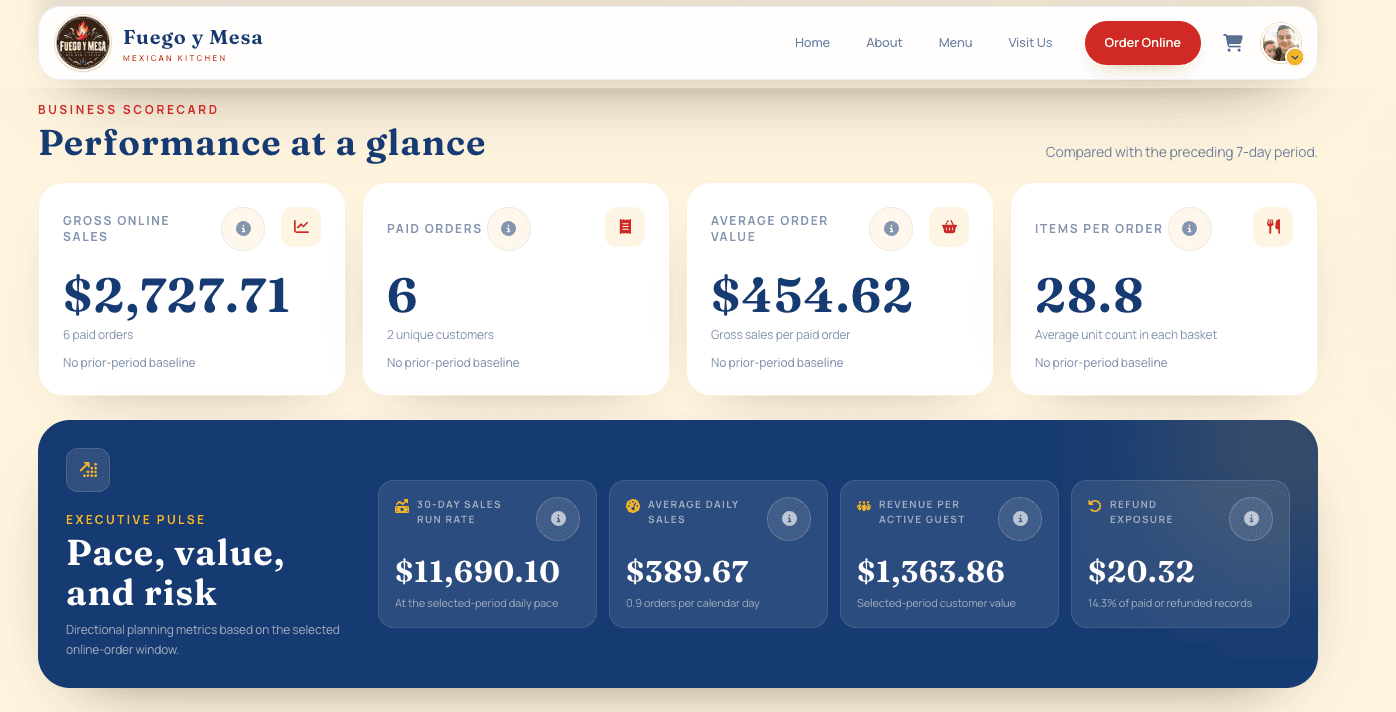
Compare gross online sales, paid orders, average order value, and items per order with the preceding reporting period.
Pace, value, and risk
Review 30-day sales run rate, average daily sales, revenue per active guest, and refund exposure.
Customer health
See new and repeat guests, repeat-customer rate, repeat sales, and the share of revenue from returning customers.
Demand planning
Understand daily sales momentum, normalized weekday performance, peak hours, and order share by daypart.
Basket growth levers
Measure add-on attachment, customized orders, menu reach, common pairings, and directional average-order-value scenarios.
Menu intelligence
Rank dishes by units, order reach, tracked item sales, and revenue share to identify dependable menu drivers.
Fulfillment and refund health
Track completion share, active workload, average and slow-tail completion times, refunded orders, and returned value.
Ranked action queue
Translate actual paid-order signals into prioritized opportunities and recommended next actions for the owner.
Daily sales momentum
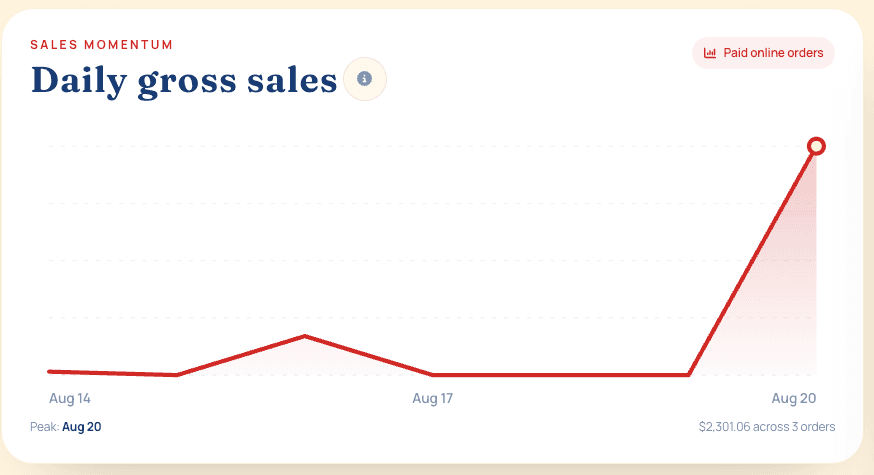
See when paid online revenue rises or falls and compare patterns across the selected reporting window.
Top revenue drivers
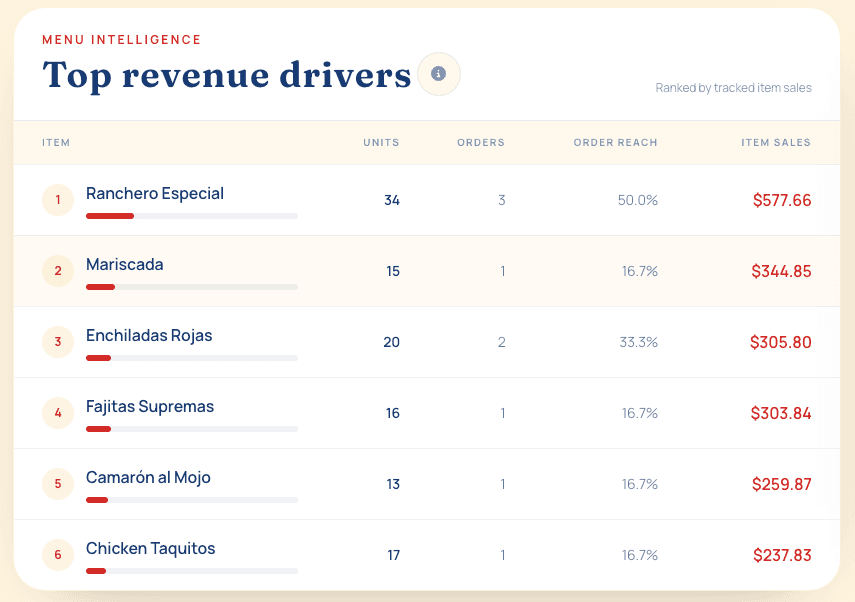
Identify the dishes generating tracked item sales and how widely each one reaches across paid orders.
Revenue opportunities
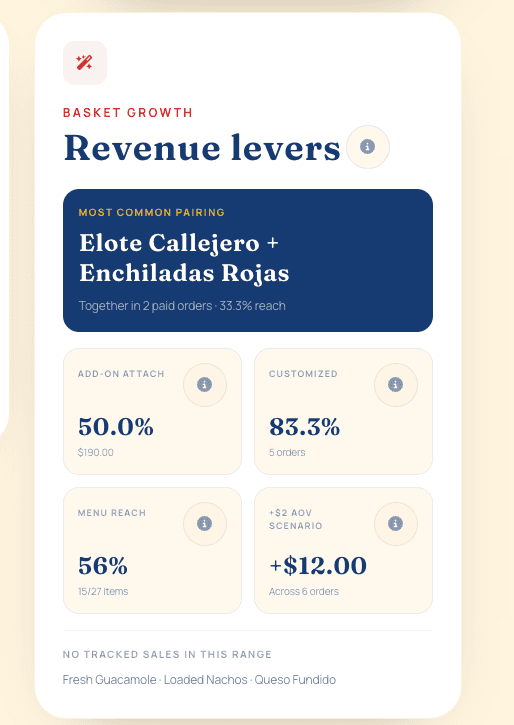
Review basket pairings, add-on attachment, customization, menu reach, and directional ticket opportunities.
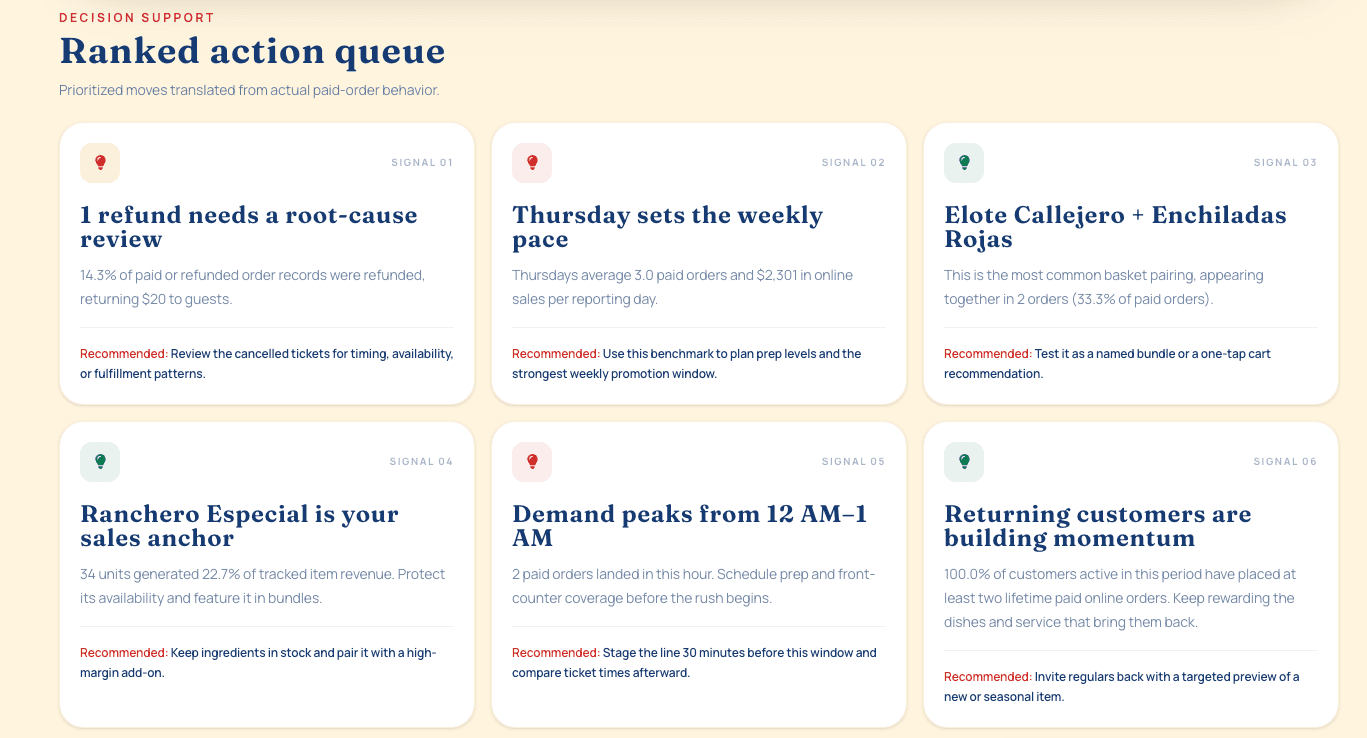
A ranked action queue
Turn paid-order behavior into prioritized recommendations the restaurant can investigate next.
Information with an operational purpose
Use restaurant data with its limits clearly explained.
Every metric includes context about how it is measured, why it matters, and where the number can mislead. Owners can compare reporting ranges without confusing gross online sales with profit or treating a directional scenario as a forecast.
The analytics use paid online orders recorded inside the Web Studios platform. Gross sales include sales tax, while food cost, labor, dine-in sales, marketplace orders, and partial-refund analysis are not included. Outside POS, accounting, inventory, or payroll integrations must be confirmed and scoped separately.
Compare performance
See current scorecards beside the preceding reporting period instead of reading isolated totals.
Plan for demand
Use weekday pace, peak hours, and dayparts to inform prep, staffing, and pickup coverage.
Understand the basket
Review menu reach, item drivers, pairings, add-on attachment, and customization behavior.
Protect operations
Keep fulfillment speed, active workload, cancellations, refunds, and returned value visible.
How it works
Shape the dashboard around restaurant roles.
The owner experience is configured around who needs access, which actions matter during service, and which metrics help the restaurant understand its direct-order channel.
- 01
Map responsibilities
Identify owner, manager, and employee roles plus the actions and information each role should receive.
- 02
Configure operations
Connect incoming orders, customer information, refund controls, and day-to-day management views.
- 03
Verify permissions
Test representative accounts to confirm sensitive tools remain limited to authorized restaurant roles.
- 04
Review useful metrics
Organize revenue, customer, basket, menu, demand, fulfillment, and refund signals into clear owner-only views.
Owner dashboard + analytics FAQ
Straight answers before you decide.
Clear scope and practical boundaries, with no promises about results that depend on Google, payment providers, or other third parties.
Related restaurant services
Keep the whole customer and owner experience connected.
- AI analytics assistantAn owner-only assistant powered by Claude that answers plain-language questions about your restaurant’s sales, menu, customers, and staffing from your real order data.
- Direct ordering + paymentsA branded menu, item customization, cart, and secure Stripe checkout (credit/debit cards, Apple Pay, Google Pay, Cash App Pay, and Link where available) with 0% Web Studios sales commission.
- Accounts + easy reorderingCustomer sign-in, private order history, and a fast way to order past favorites again.
Evansville-based, serving restaurants nationwide.
Work directly with a software engineer in English or Spanish, in Southern Indiana or anywhere in the United States.
See how this service fits your restaurant.
Try the customer and owner experience, or start a focused conversation about your current website and ordering process.